
Concordance studies estimate how scores on two different tests compare when the tests measure similar constructs. For DET and IELTS Academic, that means answering a practical question: given a candidate's DET score, what IELTS score is most comparable?
Institutions that accept both tests rely on this kind of research to set requirements that lead to similar admissions decisions, no matter which test an applicant happened to take.
We introduced the overall DET–IELTS concordance in 2022, followed by a peer-reviewed publication detailing our methodology in 2023. Once DET score reports began including separate Speaking, Writing, Reading, and Listening (SWRL) subscores in 2024, we extended that research to the skill level, so institutions could align subscore-specific policies across the two tests as well. That later study didn't change the original overall-score table.
This post walks through why a skill-level concordance is useful, how we built it, what the SWRL comparisons show (including why Writing looks a bit different from the other three skills), and how institutions can put the results to use.
Why compare scores skill by skill?
For years, DET score reports included integrated subscores—Literacy, Comprehension, Conversation, and Production—rather than the four skill subscores that other English tests report.
As of July 1, 2024, DET reports also include Speaking, Writing, Reading, and Listening (SWRL) subscores, alongside the overall and integrated scores, to help institutions to align policies at the skill level.
With SWRL subscores available, institutions can set requirements that go beyond a single overall cutoff: a minimum Writing score for a writing-intensive program, for example, or a "no skill below X" policy that applies regardless of a strong overall score. A skill-level concordance supports exactly that kind of decision-making by helping institutions align both overall and skill-specific requirements between DET and IELTS.
How we built the subscore concordances
Concordance research runs into the same practical problem again and again: once a test is widely accepted, fewer candidates bother taking a second one. This makes it harder to gather enough paired scores that also represent the broader test-taking population.
For this study, we invited DET test takers who tested between April 26 and September 13, 2024 to share official IELTS Academic score reports. To keep the sample close to typical test-taking behavior, we applied a few eligibility rules:
- a certified DET test taken between April 3 and September 30, 2024;
- an IELTS test date within 90 days of the DET test date;
- and a DET attempt falling among the test taker's first seven attempts.
Unlike some earlier concordance work, we relied only on official score reports in the final analysis. That process left us with a final sample of 1,942 test takers with paired DET–IELTS scores (591 who took IELTS after the DET, and 1,351 who took it before).
From there, we followed a fairly standard concordance process: selecting eligible score pairs, removing bivariate outliers, smoothing the score distributions, weighting the paired sample so that its DET score distribution more closely matched the overall DET population, and then applying equating methods to build the tables.
We also reran the entire process across 12 combinations of defensible methodological choices to assess whether the resulting concordance held up under reasonable alternative data-handling approaches. This is good practice for any concordance study meant to inform institutional policy.
How DET Speaking, Writing, Reading, and Listening scores compare to IELTS
DET and IELTS scores were positively related across the overall score and every subscore in the paired sample: the overall correlation was 0.73, with subscore correlations ranging from 0.53 to 0.68. That's a meaningfully strong relationship, but not a perfect one, which makes sense, since the DET and IELTS use different tasks and formats to measure English proficiency. Because of that, a concordance table shows the most likely IELTS score for a given DET score, not a guaranteed equivalent score.
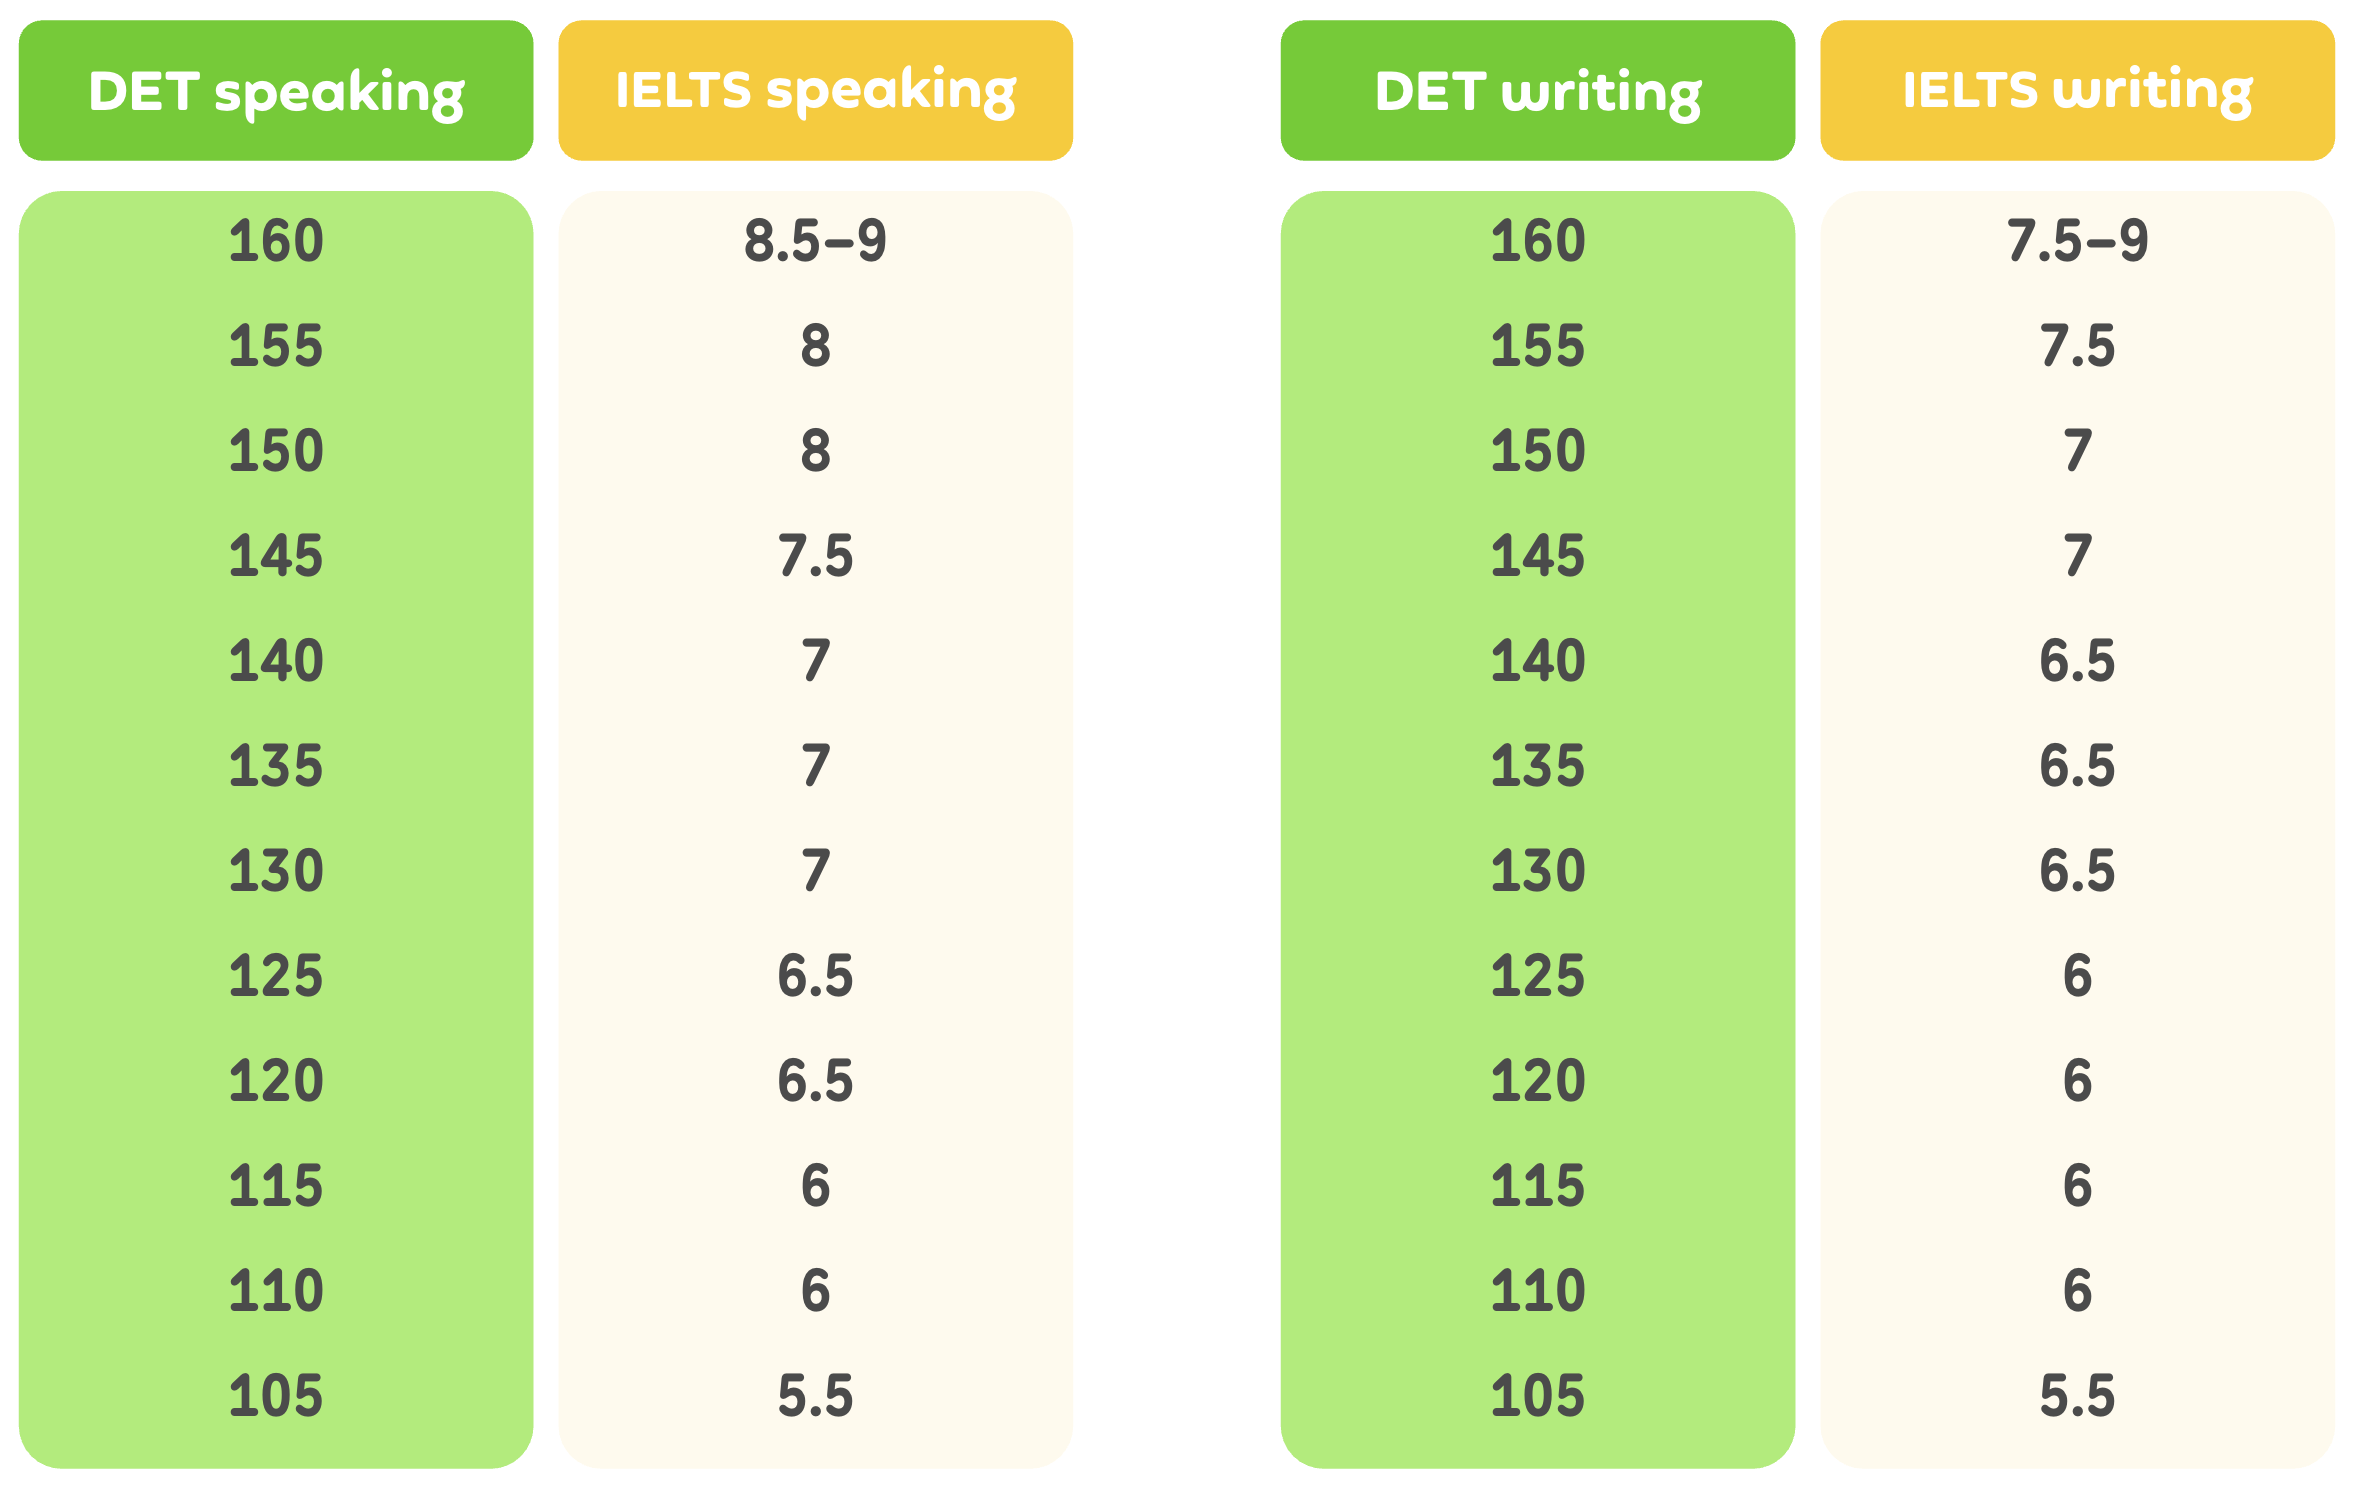
The skill-by-skill patterns were mostly similar. In the sensitivity analysis, the Reading and Listening concordances mapped across the full range of DET scores to the full range of IELTS scores, and Speaking mapped nearly as broadly, reaching an IELTS value of 8.5 at the top end. Writing was the exception: depending on specific analytic choices, the Writing concordance topped out at 7.5 or 8.0.
That gap is worth explaining, because it reflects a pattern in the IELTS data itself, not the DET Writing construct. Across both of our DET–IELTS concordance studies (comprising more than 3,500 official IELTS score reports), we did not observe a single IELTS Writing score of 8.5 or 9.0, and found only a handful of 8.0s. Other recent concordance studies pairing IELTS with other tests have reported similar patterns at the top of the Writing scale, suggesting the gap isn't just a quirk of our particular sample. With so few observations above 7.5 across multiple large, independent samples, the concordance has nothing to anchor a mapping to at those highest points, which caps how high the Writing concordance can extend. In short, the pattern we observe says more about the observed distribution of IELTS Writing scores than it does about DET Writing.
We also checked whether the overall concordance (i.e., the one first published in 2022) remained consistent with these newer skill-level results. And it did! Comparing this study to the original overall concordance work, all DET score point mappings were within the margin of error expected due to ordinary sampling variability. We also compared the direct overall-score mapping against an "implied" overall score built by averaging the SWRL subscore concordances, and again found only small discrepancies. Given these results, we did not need to revise the official overall concordance table when the SWRL tables were introduced; it remains the same table published in 2022.
How should institutions use the subscore concordance tables?
The main point to keep in mind is that concordances support similar decisions, not identical ones. Two scores linked by a concordance table aren't "the same" in every sense — they mark equivalent standing, the same percentile, relative to a common population of test takers on each test, not a prediction of what any individual candidate would score if they took the other test. Concordances are therefore most useful as a policy-setting tool rather than a way of adjudicating individual cases.
With that in mind, we'd suggest a few things when applying the SWRL concordance:
- Use it to align subscore-specific requirements (e.g., a minimum Writing score for a writing-intensive program) the same way you'd use the overall concordance to set an overall cutoff.
- Treat concordance tables as tools for setting policy-level thresholds and guidelines, rather than as proof that any two individual scores are equivalent.
- Apply extra caution at the low and high ends of the score range (roughly below 60 or above 150), where the paired sample has fewer observations, and the concordance is correspondingly less stable.
Our ongoing commitment to transparency
Concordance tables get used in high-stakes admissions decisions, so we try to be as transparent about our methods as the underlying data allows. This study followed the same approach as our original overall concordance work, along with the "good practice" principles for concordance research described by Knoch and Fan (2024): relying on official score reports; documenting every methodological choice around weighting, smoothing, and equating; running a multi-condition sensitivity analysis; and being explicit about where the concordance is (and isn't) reliable. We think score users deserve that context alongside the tables themselves.
The DET–IELTS concordance, both overall and skill-by-skill, provides institutions with a defensible way to align policies between the two tests. The overall table has held steady since 2022, and the SWRL tables provide the same evidence for Speaking, Writing, Reading, and Listening.
Frequently Asked Questions
Q: Do institutions need to change their overall DET requirement based on this research?
A: No. The subscore concordance study confirmed that the overall DET–IELTS concordance published in 2022 remains stable, and therefore the official overall table was not revised.
Q: Why does the Writing concordance top out at a lower score than Speaking, Reading, or Listening?
A: Because of the IELTS Writing score distribution. We received only four IELTS Writing scores of 8.0 and none at 8.5 or 9.0. Other recent concordance studies with IELTS have shown the same phenomenon.
Q: Is the SWRL concordance consistent with the overall concordance?
A: Yes. Comparing the direct overall-score mapping to an implied overall score derived from the SWRL subscores yielded a maximum difference of 0.375 IELTS bands, small enough not to impact institutional decision-making.
Q: What's the difference between DET's integrated subscores and SWRL subscores?
A: Integrated subscores (Literacy, Comprehension, Conversation, Production) combine multiple skills, while SWRL subscores report Speaking, Writing, Reading, and Listening individually — the four skills IELTS and most other English tests also report separately. We can only defensibly build concordance tables for score types that both tests report, so concordance tables exist for the individual (SWRL) subscores but not the integrated subscores, which are unique to DET reporting. Because the two sets overlap substantially in what they measure, we don't recommend building requirements around both simultaneously; institutions should choose whichever subscore type best fits their policy needs.